operations · analytics · sql · e-commerce
Complete · 2026
TikTok Shop Ecommerce Operations and Analytics Internship
Collectibles Central Campaigns, Seattle, Washington
- 300
- seller livestreams
- 6-figure
- incentive budget
- 25,000
- merchants mapped
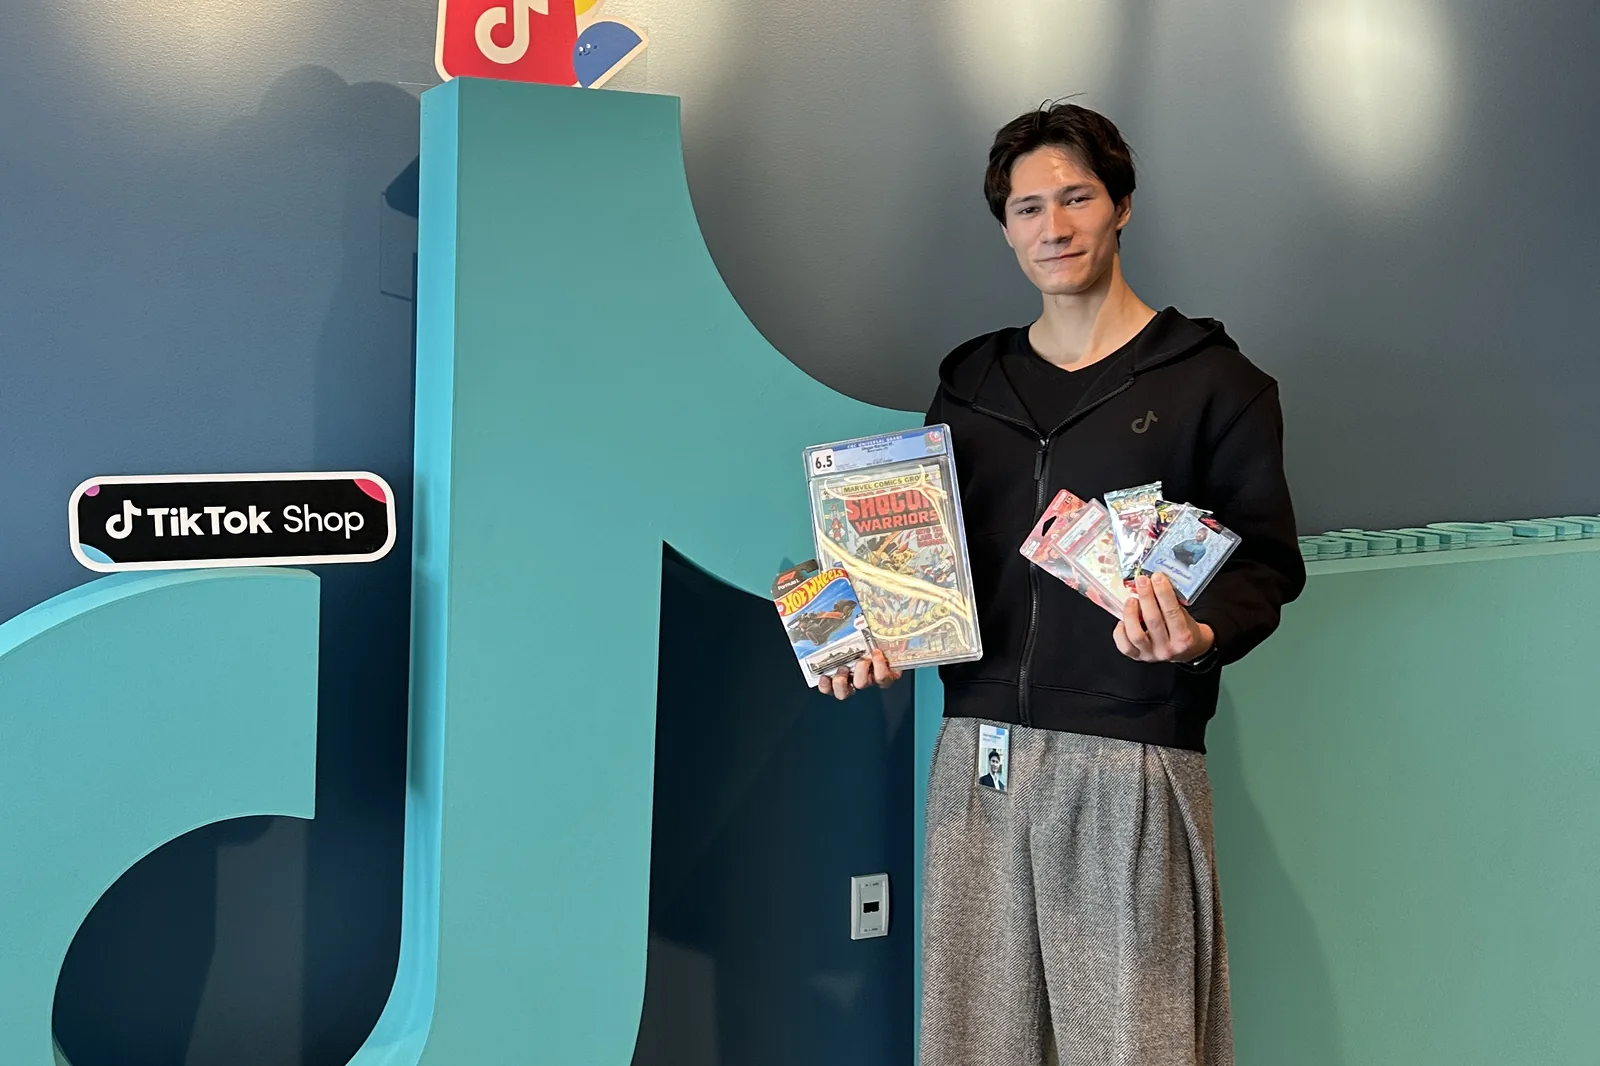
TikTok Shop's Collectibles vertical is livestream commerce at its most literal: graded comics, sealed trading card product, sports memorabilia, and coins and bullion, often sold live by people who open packs on camera for hours at a time called “breakers” or “resellers.” I spent 2026 on the Collectibles Central Campaigns team in Seattle, Washington. Three sub-teams sat underneath it: TCG and sport resellers, coins and bullion, and manufacturers. The operations and analytics work below is what all three ran on.
Part I — Where the incentive money went
A coupon is a set of rules, and the rules are the entire design. I managed a six-figure incentive budget across roughly 300 seller livestreams, and every campaign came down to three decisions: the discount itself, either a fixed dollar amount or a percentage; the minimum spend that unlocks it; the number of coupons allocated for a campaign, seller, or livestream.
Fixed amounts and percentage-based coupons were based on the seller's tendencies and livestream mechanisms. Fixed amounts may work better if the seller is looking for a higher quantity of coupons to drive more sales. In contrast, percentage-based coupons may work better for sellers who want to allow buyers to customize discounts and scale them with more expensive purchases. In collectibles, the floor for purchases can be as low as a few bucks for single packs, or four figures for graded cards; they're all sold on TikTok Shop.
The minimum spend threshold is where coupon design mechanisms play a large role. If set above a seller's typical basket, it pushes viewers to add a second item; set below it, and it hands a discount to a purchase that was already happening. Combining this logic with multiple coupons and therefore multiple thresholds, a tiered coupon system can be created to accommodate all types of buyers in a livestream. Minimum spend thresholds vary with every livestream and are dependent upon what the seller wants to push or particularly sell, which requires additional collaboration.
The number of coupons allocated for a campaign, seller, or livestream varies with the design mechanisms and the budget. It is paramount not to exceed the budget, but also to allocate enough coupons that will be fully utilized. Not everyone who claims a coupon will use it, taking an opportunity away from another buyer. To accommodate this, extra coupons are allocated; if every coupon was fully claimed by the end of the livestream, this may result in exceeding the budget. This is yet another design decision I made while creating coupons.
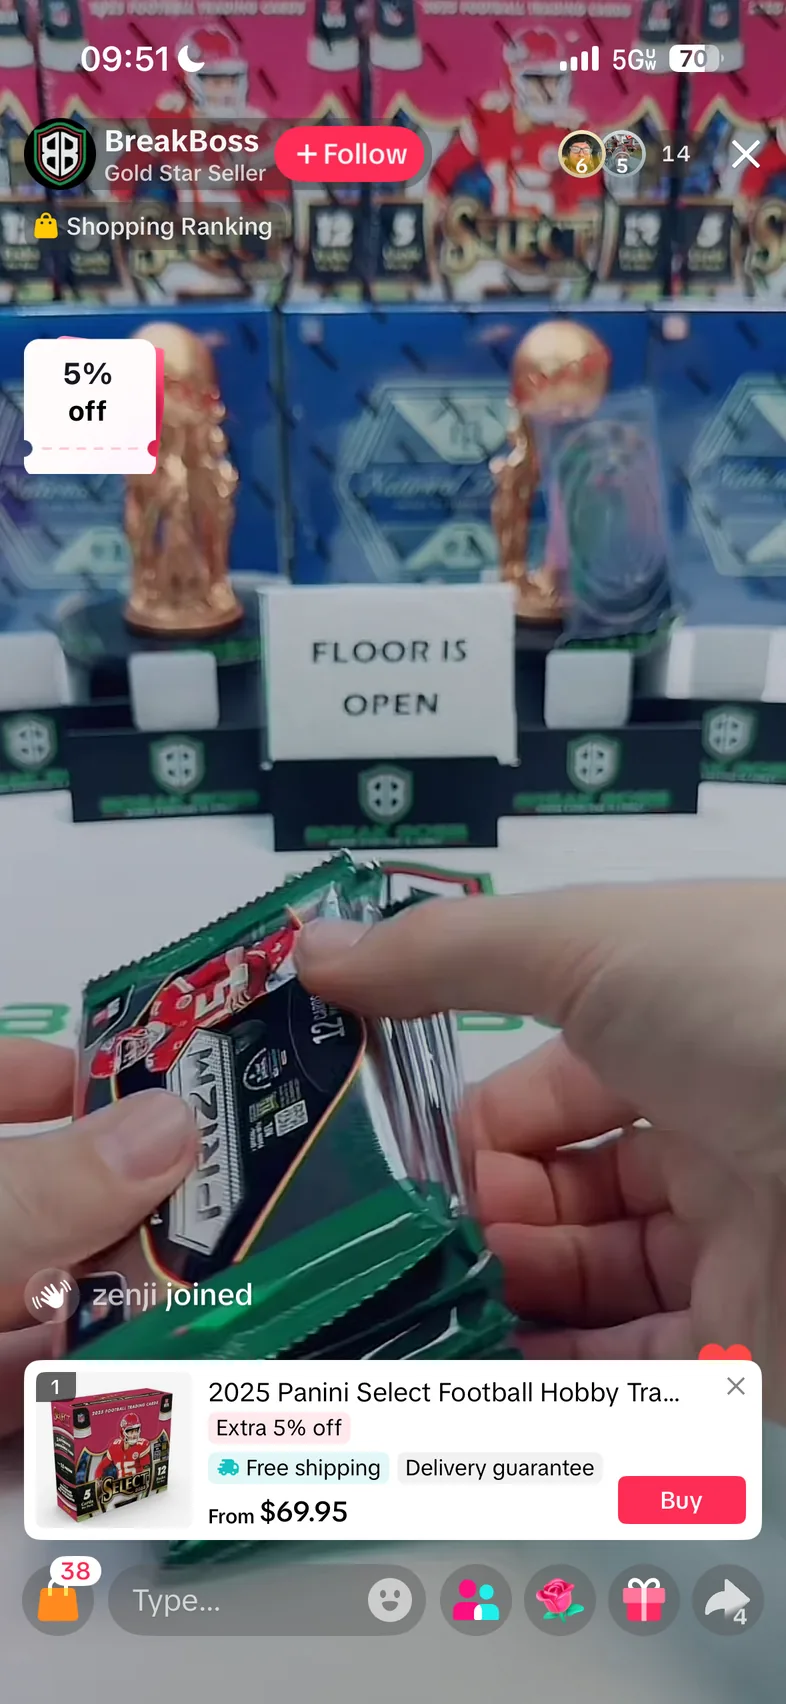
I. A stream mid-break, with the incentive attached to it
The question an incentive budget and generally platform intervention always ends on is whether it contributed towards an impact that would have happened anyway. That is the incrementality and cannibalization problem, and livestream commerce makes it difficult to measure: if a big release occurs, questions for the operations team to answer are how much more revenue was driven by this specific release, and what impact did the operations team have on this growth? I conducted analysis into this and created gross merchandise value (GMV) impact trackers to measure the revenue attached to specific product drops: quantifying how a Pokémon set or a football release drove a spike. Overall, factoring in the coupons I designed and the analysis I conducted, I helped contribute towards a team-wide $XXM in incremental revenue over my internship period.
Part II — Reporting that was being done by hand
The 30-person team's weekly business report was assembled manually, and I rebuilt portions of it as automated Excel dashboards that tracked livestream KPIs against revenue goals for all three sub-teams. It returned a few hours a week that upper management had been spending on assembling the data, enabling more time for other tasks.
Mechanically, it is ordinary Excel with a plethora of functions to function automatically: XLOOKUP for cross-sheet seller matching in Excels that update automatically, FILTER and UNIQUE to pull each week's population out of a raw SQL export, VSTACK to append weekly datasets into one panel, array formulas over MAXIFS to surface the top performers within each sub-team, and INDEX/MATCH for the multi-criteria lookups XLOOKUP cannot express. IFERROR wrappers sit over all cells and sections, indicating differently where there are genuine errors with the numbers and where there is simply no data. Conditional formatting carried the actual reading of it, so the state of the overall team and sub-teams is understandable before diving into the numbers.
Part III — Twenty-five thousand merchants, and where they fall out
I mapped revenue funnels for 25,000 merchants in SQL and Excel, correlating platform policy violations with underperformance and isolating the points where sellers dropped out. In the end, the output I created was more than a report. It was the targeting list the seller outreach ran against for sellers at different drop-off points, as outreach tactics can vary.
The data for the onboarding funnel shows over 20 steps across multiple databases and datasets, all of which I had to sift through and compile into 1 Excel to aggregate the data. Combining time-series data for when sellers dropped off with other datasets such as platform policy violations, I was able to generate correlations on why sellers may have dropped off. Violations may suppress a seller's reach or inhibit them from selling on the platform.
Part IV — Turning a top-down target into something a sub-team can act on
The Q2 forecasting models I built in SQL and Excel became the team's Q3 planning benchmarks. The work was translation, as an OKR handed down as a quarterly number is not actionable on a Tuesday in the middle of a month. The OKR had to be decomposed into month-to-date and quarter-to-date metrics for each sub-team to see if they are behind while there is still time in the quarter left to do something about it. A large layer of complexity was added when factoring in a corporate reorganization.
A note on what is shown here. The livestream above is a public shopping stream any viewer could have captured, and the five percent coupon on it is one I configured. Internal figures are redacted rather than approximated — $XXM is a real number I am not free to publish, and a redaction is more honest than a rounded stand-in. Everything else on this page is public, an order of magnitude, or a count of my own work, and nothing here includes seller-level performance data or anything identifying an individual account manager.